Site Navigation:
Craig's twitter feed:
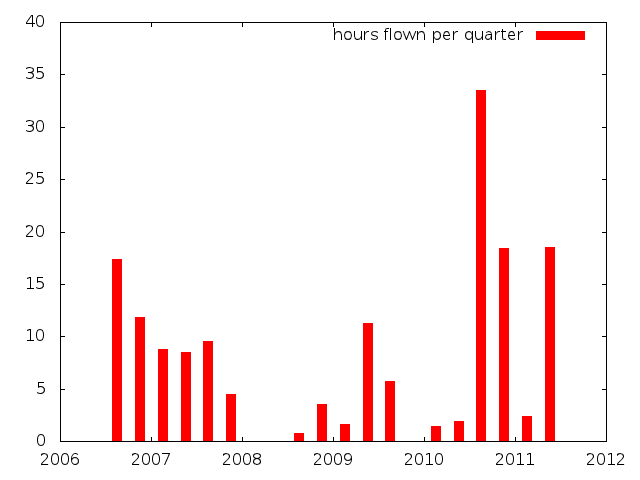
I've been figuring out how to make proper bar graphs in gnuplot, so
that I could make this chart. This type of bar graph doesn't work
with "with impulses" if you make the line width wide; the bars extend
below the horizontal axis and it looks like crap. Instead, you use
the plot command thusly:
plot './hours_flown_quarters_2011aug06a.dat' with boxes fs solid title
'hours flown per quarter'
Here's the graph of my flying hours through the present. I've done
pretty well over the last year. The important thing is to keep a
steady level of hours to stay current.